
ANALYTICS & CUSTOMERS
See retention in real-time. Know who's at risk.
KPI dashboards, retention trends, reason breakdowns, revenue tracking, customer risk scores, and feedback logs - all from real session data.
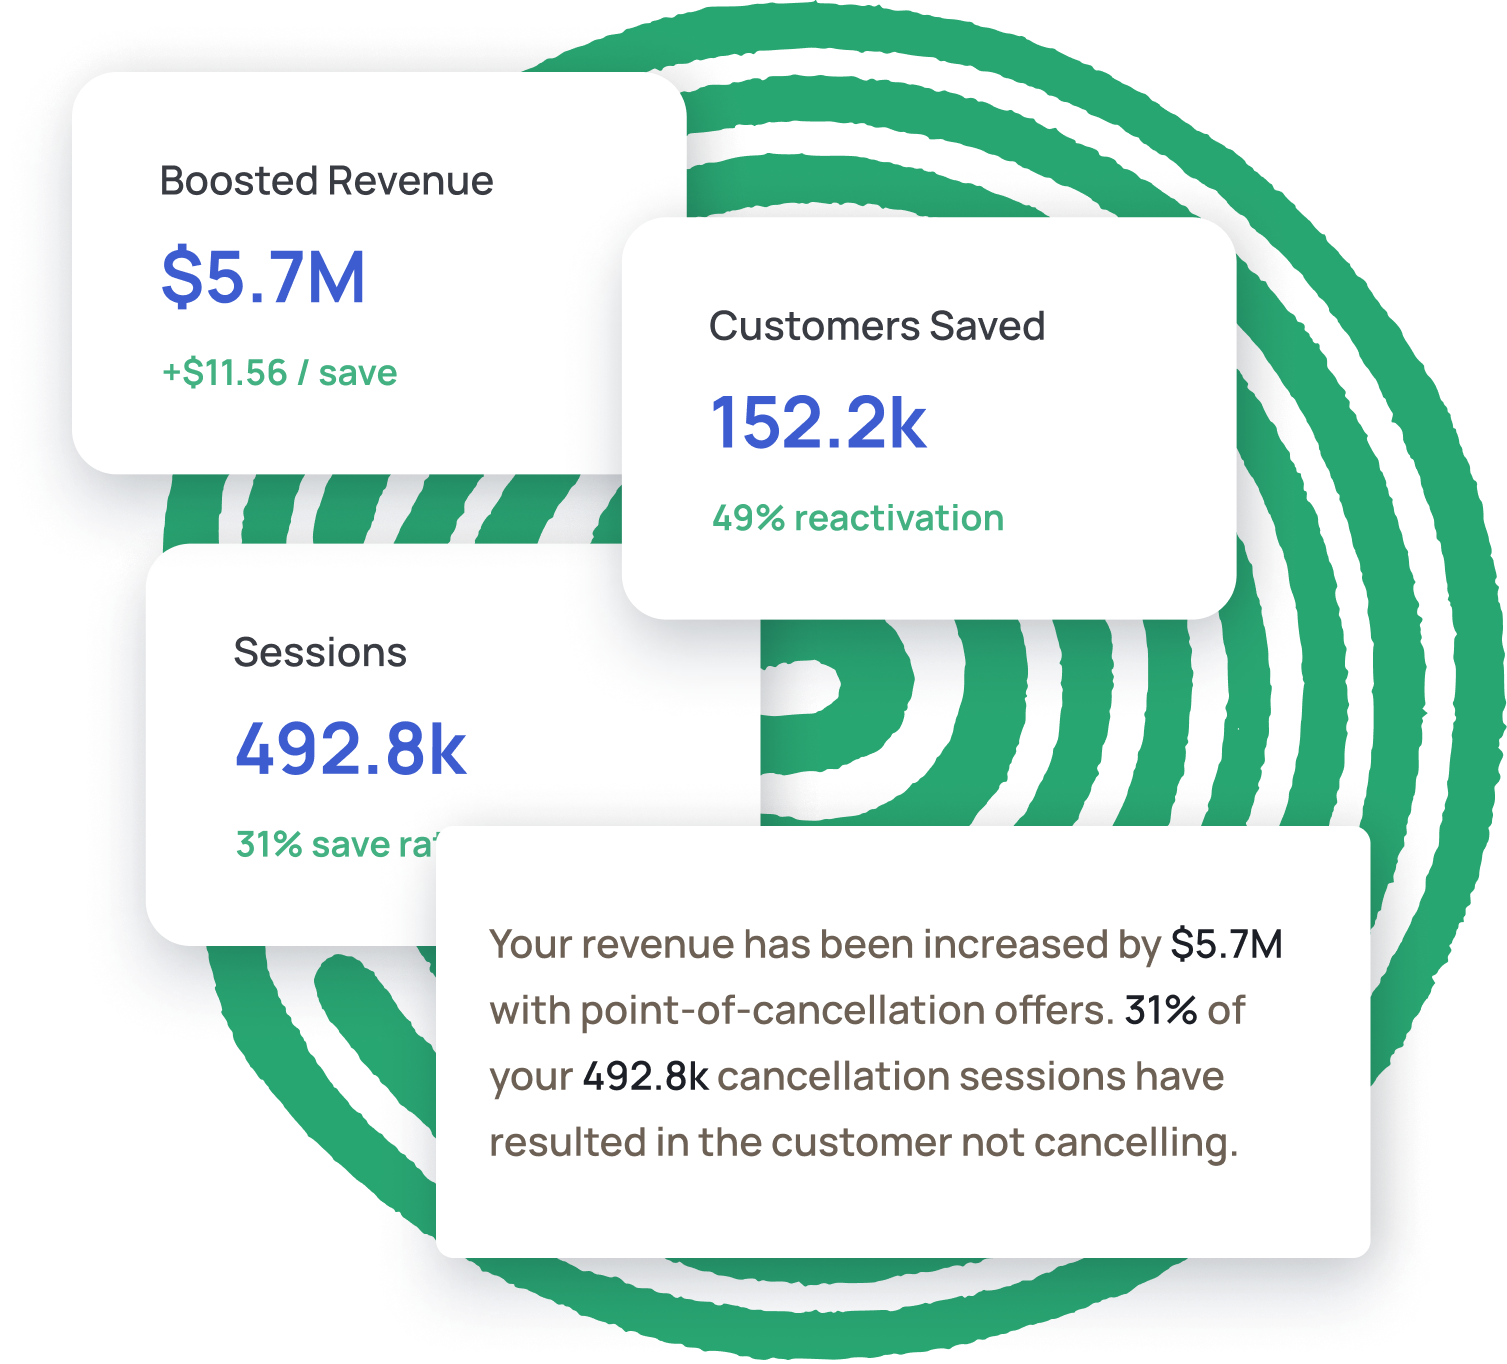
Real-Time Churn Trends, Revenue Saved & Exit Insights
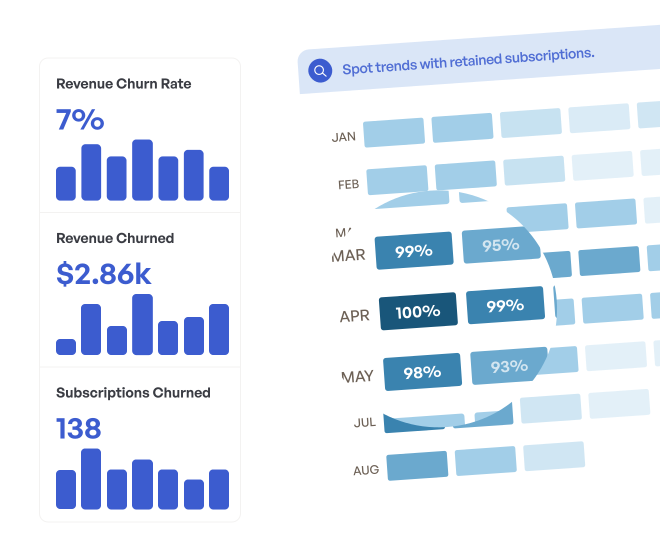
Monitor KPIs with interactive charts: track MRR saved, compare retained vs cancelled subscriptions, and discover top reasons behind cancellations.
HOW IT WORKS
Step by step
Data flows automatically
Every session, answer, and outcome is recorded. Customer records auto-update with risk scores.
Monitor dashboards
The Analytics page shows trends, breakdowns, and revenue metrics. The Customers page shows individual risk profiles.
Export and act
Export CSV for your CRM. Use the Feedback Log to read verbatim customer responses. Spot patterns, fix issues.
Who this is for
Weekly churn reviews
Open the dashboard every Monday. Check retention rate, review top reasons, and decide if offers need adjusting.
Customer success teams
The Customers page shows who's at risk. Proactively reach out to high-risk accounts before they cancel.
Board reporting
Export retention data as CSV. Show revenue saved, retention rate trends, and churn reduction metrics.
Frequently Asked Questions
The risk score (0-100%) is calculated based on the customer's cancel rate and cancellation frequency across all their sessions. Higher cancel rates and more frequent cancellation attempts result in higher risk scores.
Yes. The Customers page and Feedback Log both support CSV export. You can download customer data with risk scores and session history, or feedback data with answers and outcomes.
The main analytics dashboard supports 7-day, 30-day, 90-day, and All-time date range filters. Per-flow analytics show lifetime data for each individual flow.
Ready to reduce churn?
Free forever. No credit card required.